|
95% SW Score The SW Score ranks the products within a particular category on a variety of parameters, to provide a definite ranking system. Read more
View Details
|
95% SW Score The SW Score ranks the products within a particular category on a variety of parameters, to provide a definite ranking system. Read more
Start Free Trial
|
95% SW Score The SW Score ranks the products within a particular category on a variety of parameters, to provide a definite ranking system. Read more
View Details
|
Sponsored
79% SW Score The SW Score ranks the products within a particular category on a variety of parameters, to provide a definite ranking system. Read more ManageEngine OpUtils
Visit Website
|
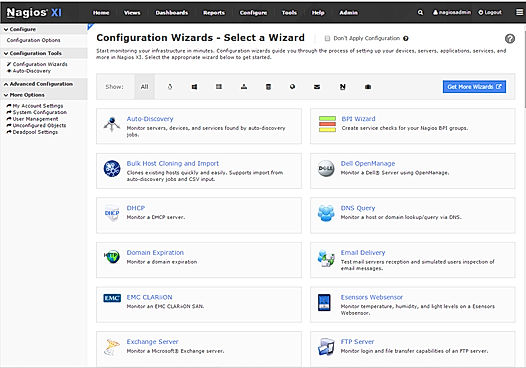
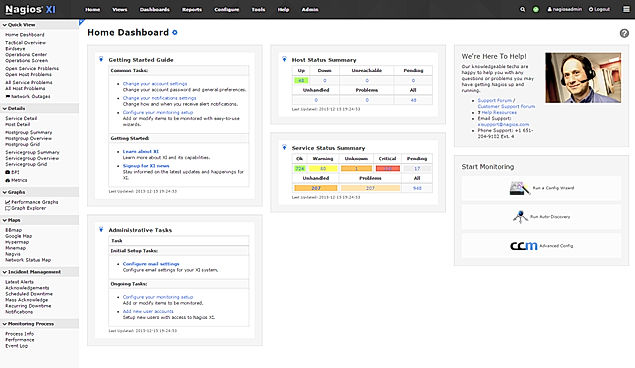
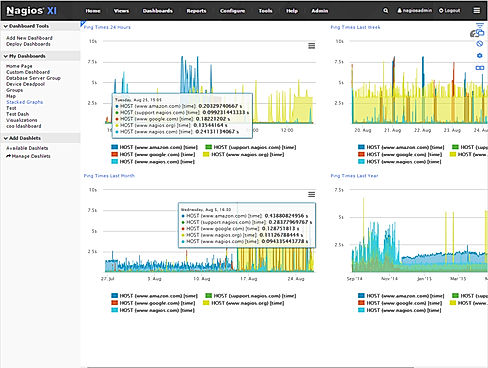
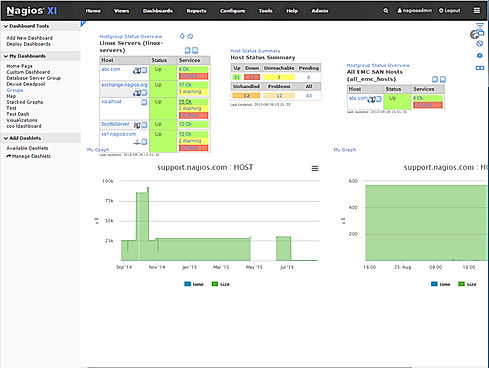
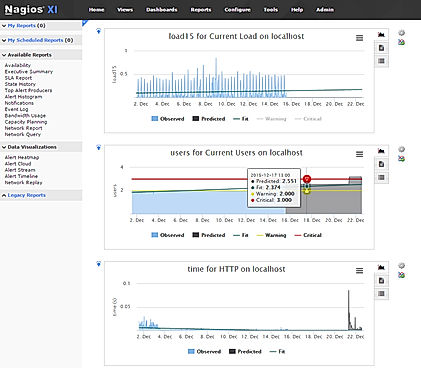
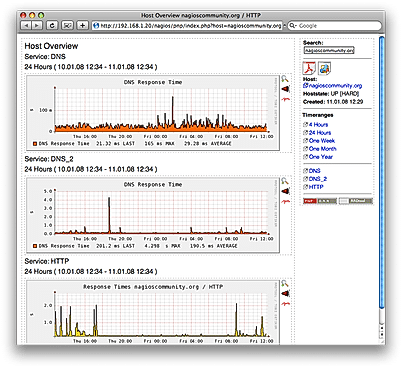
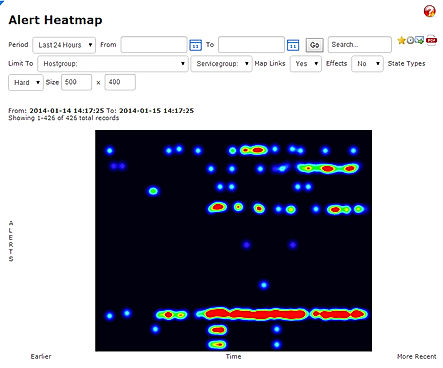
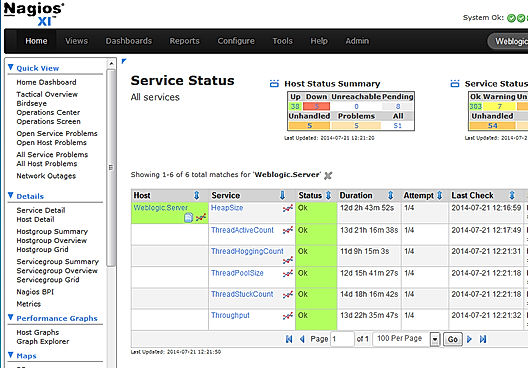
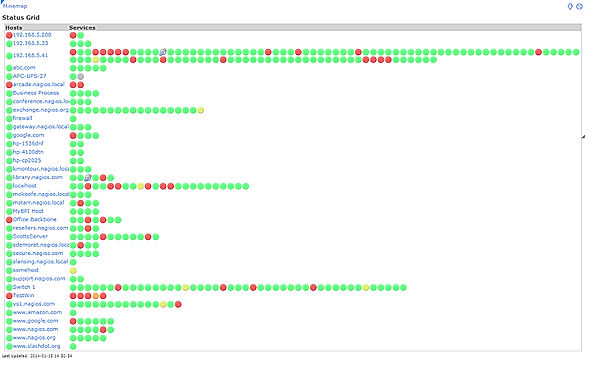
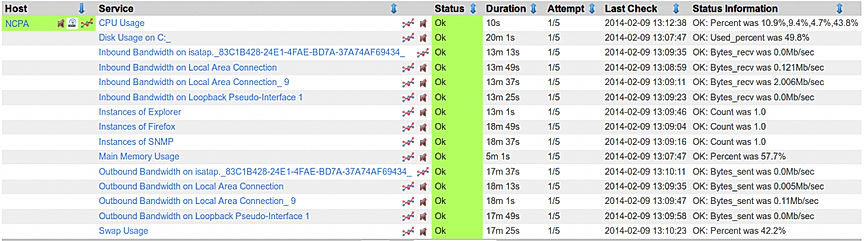
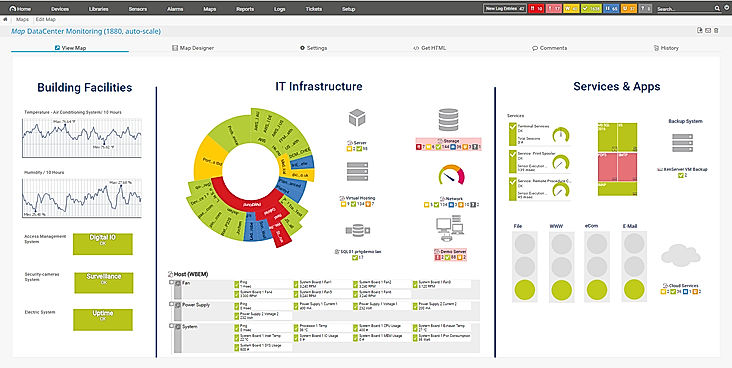
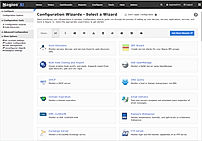
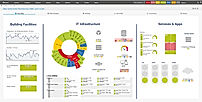
| Description | Nagios XI is claimed to be the most trusted open source network monitoring software available in the market.The software truly comes equipped with a myriad of network monitoring features that include resource management, server monitoring, SLA monitoring, uptime monitoring, internet usage monitoring, bandwidth monitoring IP address monitoring and offers web traffic reporting etc.It also offers baseline manager, real time analytics and diagnostic tools.You can smartly and easily monitor all your network equipment such as routers, switches, servers etc.Tracking traffic on the network at anytime also becomes easier.It comes with an intuitive interface and is customizable too. Read more | Grafana is software that assists companies to monitor everything from Prometheus & Graphite metrics, logs, applications, beehives, power plants, sourdough starters, and custom data sources. It makes metric visualization tools that are more accessible and easy to use across the entire company. Grafana cloud plan collects, analyzes, and alerts users on Graphite and Prometheus metrics and Loki logs on highly available, high-performance, and fully managed Grafana Cloud platforms. Users can get visibility into all data sources and metrics across their teams without jumping through multiple tabs and tools. The platform enables users to get massive query performance and high efficiency for their Prometheus metrics at any scale. Users can also access Grafana Enterprise, which includes access to enterprise plugins that take users' existing data sources and allow them to drop them right into Grafana. This will enable users to get the best out of their complicated and expensive monitoring solutions and databases by visualizing all the data more easily and effectively. Read more | PRTG Network Monitor is a comprehensive network monitoring software that helps organisations keep their systems, devices, traffic and applications free from any troubles. The software provides powerful and easy-to-use solutions to businesses of all sizes. In an organisation’s network, it focuses on the bandwidth, database, running applications, cloud storage, server, LAN and Simple Network Management Protocol, ensuring seamless operations. PRTG Network Monitor integrates with pre-existing components of users’ network and analyses live status information to provide the best solutions. The software is customisable and its functionalities can be extended for using HTTP API and custom sensors. PRTG Network Monitor is an AI-based platform that automatically solves cluster failover solutions avoiding any delay. The software can monitor several networks in different locations and within the organisation with PRTG Remote Probes. It provides in-depth reports based on live and historical data monitoring, enabling users to take the right action at the right time. Read more | OpUtils is IP address and switch port management software that is geared towards helping engineers efficiently monitor, diagnose, and troubleshoot IT resources. OpUtils complements existing management tools by providing troubleshooting and real-time monitoring capabilities. It helps network engineers manage their Switches and IP address space with ease. Monitor the critical servers in the network for availability and alert on network issues that require immediate attention. Scans the subnet to get details on CISCO devices and collects details like device snapshot, IOS details, flash memory details, and more. Read more |
| Pricing Options |
|
|
|
|
| SW Score & Breakdown |
95% SW Score The SW Score ranks the products within a particular category on a variety of parameters, to provide a definite ranking system. Read more
|
95% SW Score The SW Score ranks the products within a particular category on a variety of parameters, to provide a definite ranking system. Read more
|
95% SW Score The SW Score ranks the products within a particular category on a variety of parameters, to provide a definite ranking system. Read more
|
79% SW Score The SW Score ranks the products within a particular category on a variety of parameters, to provide a definite ranking system. Read more
|
| SaaSworthy Awards |
Not Available
|
# 5 Fastest Growing # 2 Most Popular |
Not Available
|
Not Available
|
| Organization Types Supported |
|
|
|
|
| Platforms Supported |
|
|
|
|
| Modes of Support |
|
|
|
|
| API Support |
|
|
|
|
| User Rating |
|
|
|
|
| Rating Distribution |
|
|
|
|
| User Sentiments |
Not Available
|
Easy to Use Interface, Extensive Customization Options, Powerful Visualization Capabilities, Wide Range of Data Source Integrations Steep Learning Curve, Slow Loading Times, Limited Alerting Functionality, Complex Querying Language |
Ease of Use, Comprehensive Monitoring Capabilities, Extensive Customizability, Effective Alerting System Limited Linux Support, Occasional Performance Issues, Steep Learning Curve, Sensor-Based Pricing Model |
Not Available
|
| Review Summary |
Not Available
|
Grafana is widely praised for its powerful visualization capabilities, allowing users to create custom dashboards that provide insightful views of data from a variety of sources. Users appreciate its flexibility, extensive plugin library, and ease of integration with various monitoring tools. However, some users find the initial setup and configuration process complex, and point to limitations in its alerting capabilities. Despite these drawbacks, Grafana remains a popular choice for monitoring and analysis, particularly for those seeking a customizable open-source solution. |
PRTG Network Monitor garners praise for its comprehensive monitoring capabilities, customizable alerts, and user-friendly interface. Reviewers appreciate its ability to monitor various aspects of IT infrastructure, including network performance, server uptime, and application availability. They also highlight the customizable dashboards and reporting features that enable tailored monitoring and analysis. However, some users mention occasional performance issues and a learning curve associated with setting up complex monitoring scenarios. Overall, PRTG Network Monitor is well-received for its robust monitoring features and customization options, making it a reliable choice for IT professionals seeking a comprehensive monitoring solution. |
Not Available
|
| Pros & Cons |
|
|
|
Not Available
|
| Read All User Reviews | Read All User Reviews | Read All User Reviews | Read All User Reviews |
AI-Generated from the text of User Reviews
| Pricing Options |
|
|
|
|
|
Pricing Plans
Monthly Plans
Annual Plans
|
Free License Free Standard Edition $1,995.00 $1,995.00 One-Time License Enterprise Edition $3,495.00 $3,495.00 One-Time License |
Free Free Grafana Cloud Pro $49.00 $49.00 per month Advanced Custom |
PRTG 500 $1,750.00 $1,750.00 PRTG 1000 $3,200.00 $3,200.00 PRTG 2500 $6,500.00 $6,500.00 PRTG 5000 $11,500.00 $11,500.00 PRTG XL1 $15,500.00 $15,500.00 PRTG Enterprise Custom |
Free Free Professional $345.00 $345.00 One Time Payment |
|
View Detailed Pricing
|
View Detailed Pricing
|
View Detailed Pricing
|
View Detailed Pricing
|
|
|
Klipfolio Dashboard
4.7 Based on 778 Ratings |
|
||
| Screenshots |
+ 9 More
|

+ 3 More
|
+ 1 More
|

+ 4 More
|
| Videos |

|

|

+ 2 More
|
+ 4 More
|
| Company Details | Located in: Saint Paul, MN | Located in: New York, New York Founded in: 2014 | Located in: Nuremberg, Germany Founded in: 1997 | Located in: Pleasanton, California |
| Contact Details |
1-888-624-4671 https://www.nagios.com/products/nagios-xi/ |
Not available https://grafana.com/ |
+49 911 93775-0 https://www.paessler.com/prtg |
+1-925-924-9500 https://www.manageengine.com/products/oputils/ |
| Social Media Handles |
|
|
|
|
What are the key differences between Nagios XI and PRTG Network Monitor?
What are the alternatives to Nagios XI?
Which product is better for large-scale network monitoring?
How do the customization options of Nagios XI compare to PRTG Network Monitor?
Which product offers better reporting and analytics capabilities?
Looking for the right SaaS
We can help you choose the best SaaS for your specific requirements. Our in-house experts will assist you with their hand-picked recommendations.
Want more customers?
Our experts will research about your product and list it on SaaSworthy for FREE.